Thursday, 27 December 2018

Artemis Monitoring With Grafana

Standard


1.  Install Artemis
Download artemis from  https://activemq.apache.org/artemis/download.html

 Unzip artemis to a location
Lets call the location where Artemis is installed as ARTEMIS_HOME

2.  Create a messaging broker
 
Choose a new location to store broker. Lets call this location as "ARTEMIS_BROKERS"
 
cd to "ARTEMIS_BROKERS"

Run command  :     ./${ARTEMIS_HOME}/bin/artemis create "firstbroker"

Command will result in creation of broker with name "firstbroker" inside        "ARTEMIS_BROKERS" location 

Test the broker  by 

Goto to directory "${ARTEMIS_BROKERS}/firstbroker/bin"

Run command   ./artemis run  (on windows  artemis.cmd run)

If the everything went well  you should be able to access artemis  console  at  http://localhost:8161/console

3. Next step is to export Jmx as metrics using Prometheous jmx exporter javaagent

Download the javaagent jar jmx_prometheus_javaagent-0.3.2-SNAPSHOT.jar from  https://github.com/prometheus/jmx_exporter

Move jmx_prometheus_javaagent-0.3.2-SNAPSHOT.jar to ${ARTEMIS_HOME}/lib

You can read more about Prometheus jmx export here  https://github.com/prometheus/jmx_exporter

Download artemis-2.yml from https://github.com/prometheus/jmx_exporter/tree/master/example_configs

Move the file to ${ARTEMIS_BROKERS}/firstbroker/etc"

Stop the broker if already running

Edit command in artemis.sh file  where the  "exec"  makes call to java to launch  org.apache.activemq.artemis.boot.Artemis

Add the entry for javaagent and modified command will look like

exec "$JAVACMD" $JAVA_ARGS $ARTEMIS_CLUSTER_PROPS \
-javagent:"${ARTEMIS_HOME}/lib/jmx_prometheus_javaagent-0.3.2-SNAPSHOT.jar"="8080:${ARTEMIS_BROKERS}/firstbroker/etc/artemis-2.yml"
-classpath "$CLASSPATH" \
-Dartemis.home="$ARTEMIS_HOME" \
-Djava.library.path="$ARTEMIS_HOME/bin/lib/linux-$(uname -m)" \
$DEBUG_ARGS \
org.apache.activemq.artemis.boot.Artemis "$@"

Note :  For windows mention  relative paths for -javaagent. Giving full path  ( due to colon bein separater in javaagent options) will result in error.

Restart the broker

./artemis run  (on windows  artemis.cmd run)

Call http://localhost:8080/metrics  from browsers.

Details of Jvm is coming on the screen.

4. Enable Local Monitoring and Management to expose MBean showing broker details

Next step is to expose MBean showing broker details

To allow the JMX client access to a local Java VM, you had to set the  system property com.sun.management.jmxremote to true for the for the Artemis java process.

Update command to add -Dcom.sun.management.jmxremote=true

Final command looks like

exec "$JAVACMD" $JAVA_ARGS $ARTEMIS_CLUSTER_PROPS \
-javagent:${ARTEMIS_HOME}/lib/jmx_prometheus_javaagent-0.3.2-SNAPSHOT.jar"="8080:${ARTEMIS_BROKERS}/firstbroker/etc/artemis-2.yml
-classpath "$CLASSPATH" \
-Dartemis.home="$ARTEMIS_HOME" \
-Dcom.sun.management.jmxremote=true \
-Djava.library.path="$ARTEMIS_HOME/bin/lib/linux-$(uname -m)" \
$DEBUG_ARGS \
org.apache.activemq.artemis.boot.Artemis "$@"


Restart the broker

Call http://localhost:8080/metrics  from browsers.

Now the broker details is coming in response.


5. Install and Run Prometheus server
   
 Download Prometheus server  from https://prometheus.io/download/ and untar in a location. Lets call Prometheus server location to ${PROMETHEUS_HOME}

Update prometheus.yml  file located inside  ${PROMETHEUS_HOME}

Updated scrape_configs section looks like. We have update the targets to point to the metrics exposed by Prometheus jmx exporter agent

   scrape_configs:
  # The job name is added as a label `job=<job_name>` to any timeseries scraped from this config.
  - job_name: 'prometheus'

# metrics_path defaults to '/metrics'
# scheme defaults to 'http'.

static_configs:
- targets: ['localhost:8080']


Start the Prometheus server
Browse to  http://localhost:9090

Metrics are available on graph page

6.  Create Grafana dashboard for Artemis
 
 Download Grafana from https://grafana.com/grafana/download  based on the platform and unzip to a location .

Lets call the location as GRAFANA_HOME

Start the grafana server.

Launch the grafana console. http://localhost:3000

Create the new datasource named  DS_PROMETHEUS   of type premetheus with url pointing to Prometheus server(localhost:9090  in this case)

Create Artemis dashboard by importing  file from https://grafana.com/api/dashboards/9087/revisions/1/download

Change the instance variable to localhost:8080

 All done !!


Sunday, 16 December 2018

Elastic Search Monitoring and Troubleshooting Notes

Standard


 Get the cluster health status

curl -XGET http://localhost:9200/_cluster/health?pretty

Get shards  details

curl -XGET http://localhost:9200/_cat/shards

Force Reroute identified shard to a specific node  

         Usually required to force assing unassigned_shards to a node
for shard in $(curl -XGET http://localhost:9200/_cat/shards | grep UNASSIGNED |                  awk '{print $2}'); do
curl -XPOST 'localhost:9200/_cluster/reroute' -d '{
"commands" : [ {
  "allocate" : {
  "index" : "index_taken_from_step_2",
  "shard" : $shard,
  "node" : "datanode",
  "allow_primary" : true
  }
}
]
}'
sleep 5
done

All Shards on a node stucks in initialization statue

        Restart the box could be the only solution.


Troubleshooting  Unavailable Shard Exception

a. Index folder is deleted 
     Recreate the index

b. Node hosting primary shard left cluster
     Reboot the node


Fixing UNASSIGNED shard error

Lookup for  faulty shard 

 curl -XGET localhost:9200/_cat/shards?h=index,shard,prirep,state,unassigned.reason| grep  UNASSIGNED

  for ES5+ :
  curl -XGET localhost:9200/_cluster/allocation/explain?pretty

If it looks like the unassigned shards belong to an index you thought you deleted already,
or an outdated index that you don’t need anymore,
then you can delete the index to restore your cluster status to green:

curl -XDELETE 'localhost:9200/index_name/'


Possible Reason or unassigned shard error

Shard allocation is purposefully delayed
Too many shards, not enough nodes
You need to re-enable shard allocation
Shard data no longer exists in the cluster
Low disk watermark
Multiple Elasticsearch versions

Shard allocation is purposefully delayed


When a node leaves the cluster, the master node temporarily delays shard reallocation to avoid needlessly wasting resources on rebalancing shards, in the event the original node is able to recover within a certain period of time (one minute, by default). If this is the case, your logs should look something like this:

[TIMESTAMP][INFO][cluster.routing] [MASTER NODE NAME] delaying allocation for [54] unassigned shards, next check in [1m]
      You can dynamically modify the delay period like so:

curl -XPUT 'localhost:9200/<INDEX_NAME>/_settings' -d
'{
"settings": {
   "index.unassigned.node_left.delayed_timeout": "30s"
}
}'
       Replacing <INDEX_NAME> with _all will update the threshold for all indices in your cluster.

After the delay period is over, you should start seeing the master assigning those shards. If not,            keep reading to explore solutions to other potential causes.

  Too many shards, not enough nodes

        Node should be > replica + 1
Add new nodes or decrease replica number

You need to re-enable shard allocation

curl -XPUT 'localhost:9200/_cluster/settings' -d
'{ "transient":
{ "cluster.routing.allocation.enable" : "all"
}
}'

Low disk watermark

query :  curl -s 'localhost:9200/_cat/allocation?v'
Increase allocation
curl -XPUT 'localhost:9200/_cluster/settings' -d
'{
"transient": {
  "cluster.routing.allocation.disk.watermark.low": "90%"
}
}'
Change to "persistent" if need to persist data between restart

   Shard data no longer exists in the cluster

In this case, primary shard 0 of the constant-updates index is unassigned. It may have been created on a node without any replicas (a technique used to speed up the initial indexing process), and the node left the cluster before the data could be replicated. The master detects the shard in its global cluster state file, but can’t locate the shard’s data in the cluster.

Another possibility is that a node may have encountered an issue while rebooting. Normally, when a node resumes its connection to the cluster, it relays information about its on-disk shards to the master, which then transitions those shards from “unassigned” to “assigned/started”. When this process fails for some reason (e.g. the node’s storage has been damaged in some way), the shards may remain unassigned.

In this scenario, you have to decide how to proceed: try to get the original node to recover and rejoin the cluster (and do not force allocate the primary shard), or force allocate the shard using the Reroute API and reindex the missing data using the original data source, or from a backup.

If you decide to allocate an unassigned primary shard, make sure to add the "allow_primary": "true" flag to the request:

curl -XPOST 'localhost:9200/_cluster/reroute' -d
'{ "commands" :
  [ { "allocate" :
  { "index" : "constant-updates", "shard" : 0, "node": "<NODE_NAME>", "allow_primary": "true" }
  }]
}'
Without the "allow_primary": "true" flag, we would have encountered the following error:

{"error":{"root_cause":[{"type":"remote_transport_exception","reason":"[NODE_NAME][127.0.0.1:9301][cluster:admin/reroute]"}],"type":"illegal_argument_exception","reason":"[allocate] trying to allocate a primary shard [constant-updates][0], which is disabled"},"status":400}
The caveat with forcing allocation of a primary shard is that you will be assigning an “empty” shard. If the node that contained the original primary shard data were to rejoin the cluster later, its data would be overwritten by the newly created (empty) primary shard, because it would be considered a “newer” version of the data.

You will now need to reindex the missing data, or restore as much as you can from a backup snapshot using the Snapshot and Restore API.


Saturday, 9 June 2018

Java Simplified Encryption By JASYPT

Standard
Introduction to Jasypt


Jasypt is a java library which allows the developer to add basic encryption capabilities to his/her projects with minimum effort, and without the need of having deep knowledge on how cryptography works.

Take a simple case where we have application with customer's personal data to store in database in encrypted format 

In other case we have properties file with database credential store in encrypted form.
Jasypt library helps to  do  encryption and decryption scenarios in a very simple manner. 

Lets start with simple encryption and decryption using  BasicTextEncryptor class from the Jasypt library:

BasicTextEncryptor basicTextEncryptor = new BasicTextEncryptor();
String criticalData = "secret-data";
basicTextEncryptor.setPasswordCharArray("anythingforchararray".toCharArray())
String encryptedData= basicTextEncryptor.encrypt(criticalData);

To Decrypt
String plaintext = basicTextEncryptor.decrypt(encryptedData );

Simple isnt it !

We can use specialize class  StrongTextEncryptor   to achieve stronger encryption
StrongTextEncryptor strongEncryptor = new StrongTextEncryptor();
strongEncryptor.setPassword(myEncryptionPassword);
String myEncryptedText = strongEncryptor.encrypt(myText);
String plainText = strongEncryptor.decrypt(myEncryptedText)
Still Simple !!


we can even define encryption algorithm using Password based encryption classes  provided by jasypt. As the name suggest it requires a password to be supplied.

StandardPBEStringEncryptor encryptor = new StandardPBEStringEncryptor();
encryptor.setPassword("somepasswrd");             // set password
encryptor.setAlgorithm("PBEWithMD5AndTripleDES");    // optionally set the algorithm
// perform encyrption
String encryptedText = encryptor.encrypt(myText);
//perform decryption
String plainText = encryptor.decrypt(encryptedText);  // myText.equals(plainText)

Jasypt with SpringBoot


With spring-boot you can add maven dependency

<dependency>
    <groupId>com.github.ulisesbocchio</groupId>
    <artifactId>jasypt-spring-boot</artifactId>
    <version>2.0.0</version>
</dependency>

Add @EnableEncryptableProperties Annotations to your application
Add @PropertySource annotation to define properties files with encrypted properties
Inside properties file wrap encrypted value inside ENC()

@SpringBootApplication
@EnableEncryptableProperties
@PropertySource(name="EncryptedProperties", value = "classpath:encrypted.properties")
public class Application {
.....
}

Inside encrypted.properties
secret.key=ENC(hashed-encryptedtext); // 

 Now when you do environment.getProperty("secret.property") or use @Value("${secret.property}") what you get is the decrypted version of secret.property.

@Configuration
public class DBConfig {

@Value("${secret.property}")
String decryptedText;

......
}

Define a custom encryptor

@Bean(name = "customEcnryptor")
public StringEncryptor customEncryptorBean() {

    PooledPBEStringEncryptor encryptor = new PooledPBEStringEncryptor();
    SimpleStringPBEConfig config = new SimpleStringPBEConfig();
    config.setPassword("password");
    config.setAlgorithm("PBEWithMD5AndDES");
    config.setKeyObtentionIterations("1000");
    config.setPoolSize("1");
    config.setProviderName("SunJCE");
    config.setSaltGeneratorClassName("org.jasypt.salt.RandomSaltGenerator");
    config.setStringOutputType("base64");
    encryptor.setConfig(config);
    return encryptor;
}

Add  in application.properties file 
jasypt.encryptor.bean=customEcnryptor
to tell spring to use customEncryptor for jasypt encryption


That's all about Jasypt introduction. You can read more about jasypt features from  Jasypt home page


Friday, 18 August 2017

Apache Spark Structured Streaming

Standard


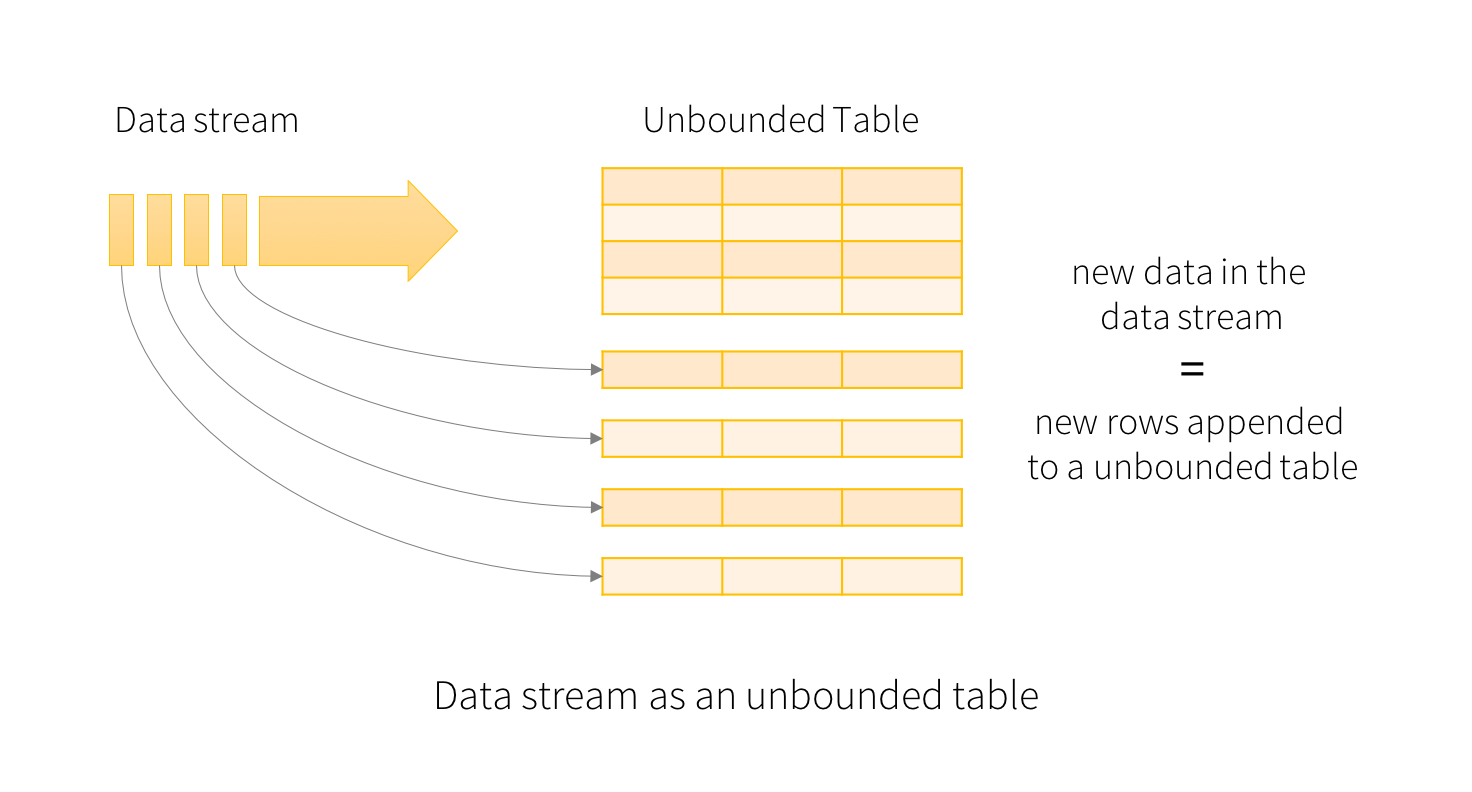
Structured Streaming is a scalable and fault-tolerant stream processing engine built on the Spark SQL engine. inshort Structure streaming rebuild streaming functionalities on top of Catalyst and Data Frames.

Structured Streaming is the first API to build stream processing on top of SQL engine,in traditional streaming we process only real-time events, structured streaming is a novel approach of processing structured data of either a discrete table of data (where you know all the data) or an infinite table of data (where new data is continuously arriving). When viewed through this structured lens of data – as a discrete table or an infinite table.


Stream as a Table
Model

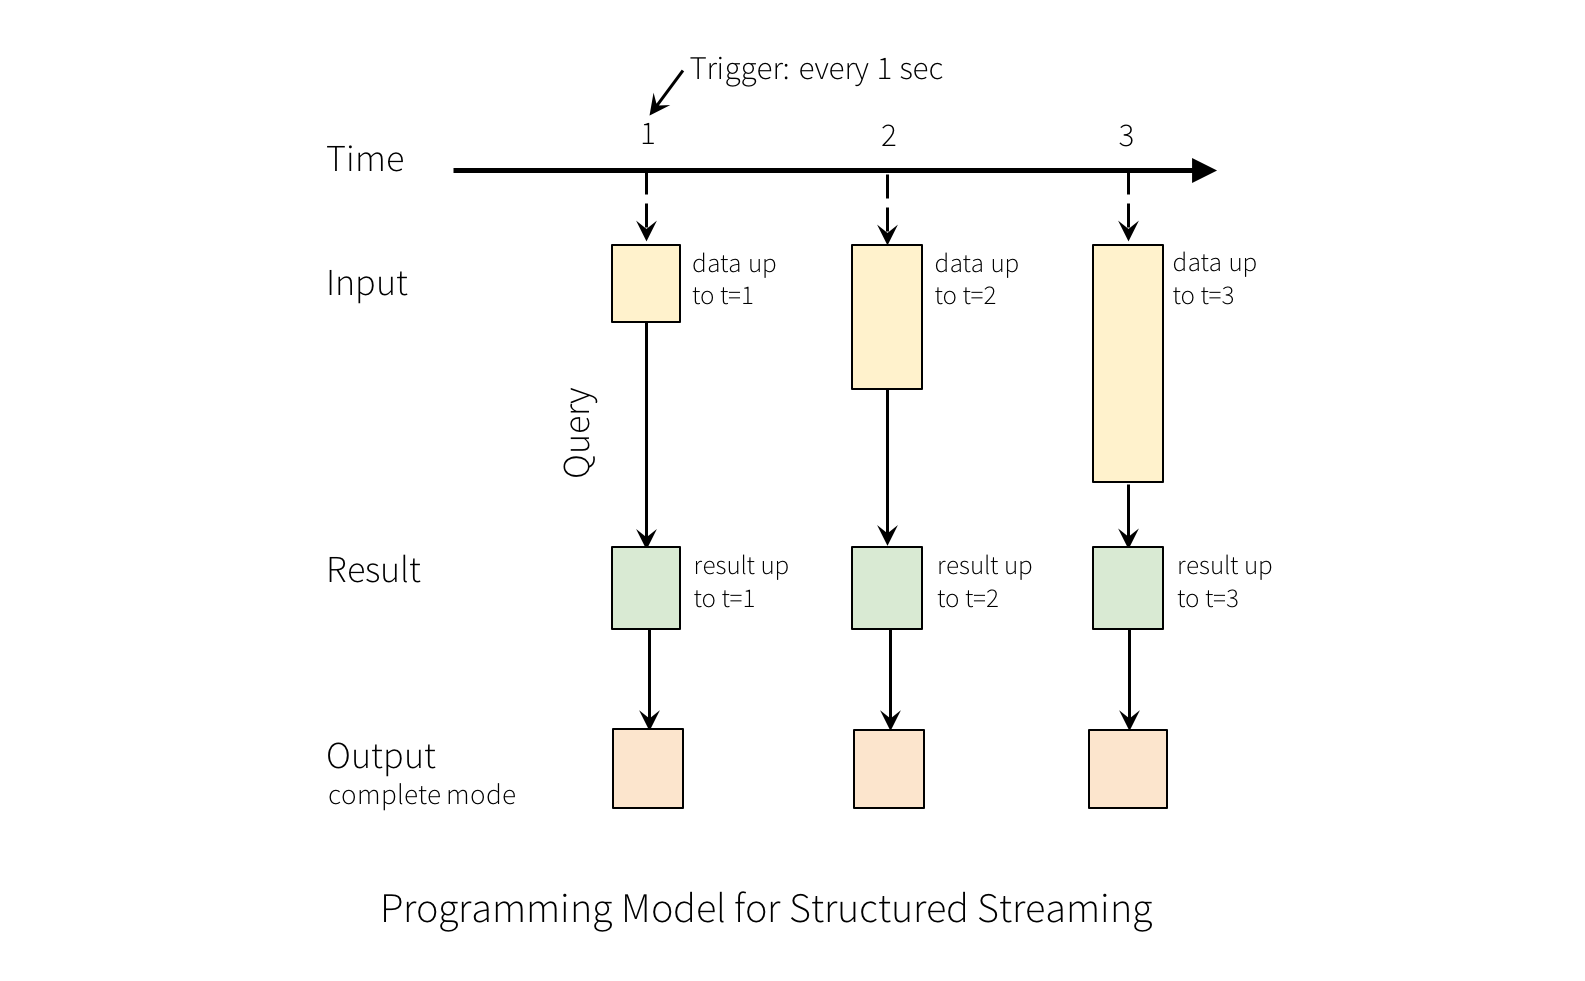
Logically, each input stream is an appendonly table (i.e. DataFrame), where records can arrive in any order across our system processing time (event time is just a field in each record).

Users define queries as just traditional SQL or DataFrame queries on this whole table,which return a new table whenever they are executed in processing time.

Users set a trigger to say when to run each query and output, which is based purely on processing time. The system makes best effort to meet such requirement. In some cases, the trigger can be gas soon as possibleh.

Finally, users set an output mode for each query. The different output modes are:

Delta : Although logically the output of each query is always a table, users can set a "delta" output mode that only writes the records from the query result changed from the last firing of the trigger.
                         
  1. These are physical deltas and not logical deltas. That is to say, they specify what rows were added and removed, but not the logical difference for some  row.  
  2.  Users must specify a primary key (can be composite) for the records. The output schema would include an extra "status" field to indicate whether this is an add, remove, or update delta record for the primary key.
Append : A special case of the Delta mode that does not include removals. There is no need to specify a primary key, and the output would not include the status field.

Update( inplace ) : Update the result directly in place (e.g. update a MySQL  table) ,similar to delta, a primary key must be specified.

Complete : For each run of the query, create a complete snapshot of the query result.

Repeated queries(RQ) :RQ simply states that the majority of streaming applications can be seen as asking the same question over and over again,the results from RQ are identical to running each query manually at various points in time, and saving either its whole output or just the difference.

Example :  How many credit card transactions happen today

                       Select * from tbl_credit_card_transactions group by card_type


  • https://spark.apache.org/docs/latest/structured-streaming-programming-guide.html
  • Author
  • Date
  • Comments No comments
  • Categories
  • Edit

Saturday, 12 August 2017

Apache Spark Broadcast vs Accumulators

Standard
Image result for apache spark

Broadcast variable :


Broadcast variable is a read-only variable that is made available from the driver program that runs the SparkContext object to the nodes that will execute the computation. This is very useful in applications that need to make the same data available to the worker nodes in an efficient manner, such as machine learning algorithms.

If a large read-only piece of data (e.g., a lookup table) is used in multiple parallel operations, it is preferable to distribute it to the workers only once instead of packaging it with every closure.Spark lets the programmer create a broadcast variable" object that wraps the value and ensures that it is only copied to each worker once.


When should use broadcast variables:

  • Allow for an efficient sharing of potentially large data sets
  • Intended for workers as reference data
  • Cached, transported via broadcast protocol, (de)serialized
Spark makes creating broadcast variables as simple as calling a method on SparkContext as follows:

> val broadcastvarableAList = sc.broadcast(List("Vaquar", "khan", test1", "test2", "test3"))

The console output shows that the broadcast variable was stored in memory,
taking up approximately 488 bytes, and it also shows that we still have 270 MB
available to us:

14/01/30 07:13:32 INFO MemoryStore: ensureFreeSpace(488) called with
curMem=96414, maxMem=311387750

14/01/30 07:13:32 INFO MemoryStore: Block broadcast_1 stored as values to
memory (estimated size 488.0 B, free 296.9 MB)

broadcastvarableAList : org.apache.spark.broadcast.Broadcast[List[String]] =
Broadcast(1)

Image result for broadcast and accumulator

Accumulators

An accumulator is also a variable that is broadcasted to the worker nodes. The key difference between a broadcast variable and an accumulator is that while the broadcast variable is read-only, the accumulator can be added to.

There are limitations to this,that is, in particular, the addition must be an associative operation so that the global accumulated value can be correctly computed in parallel and returned to the driver
program. Each worker node can only access and add to its own local accumulator value, and only the driver program can access the global value. Accumulators are also accessed within the Spark code using the value method.

These are variables that workers can only add" to using an associative operation, and that only the driver can read. They can be used to implement counters as in MapReduce and to provide a more imperative syntax for parallel sums. Accumulators can be de ned for any type that has an \add" operation and a \zero" value. Due to their \add-only" semantics, they are easy to make fault-tolerant.

When should use accumulators

  • Counters or sums that can be reliably used in parallel processing
  • Native support for numeric types, extensions possible via API
  • Workers can modify state, but cannot read content
  • Only a driver program can read the accumulated value

> val accum = sc.accumulator(0)
 accum: spark.Accumulator[Int] = 0

> sc.parallelize(Array(1, 2, 3, 4)).foreach(x => accum += x)

 10/09/29 18:41:08 INFO SparkContext: Tasks finished in 0.317106 s

> accum.value
 res2: Int = 10


  • https://jaceklaskowski.gitbooks.io/mastering-apache-spark/spark-broadcast.html
  • http://spark.apache.org/docs/latest/rdd-programming-guide.html
  • https://people.eecs.berkeley.edu/~agearh/cs267.sp10/files/mosharaf-spark-bc-report-spring10.pdf

  • Author
  • Date
  • Comments No comments
  • Categories
  • Edit